Core Web Vitals Explained: What LCP, INP, and CLS Actually Mean for Your Website
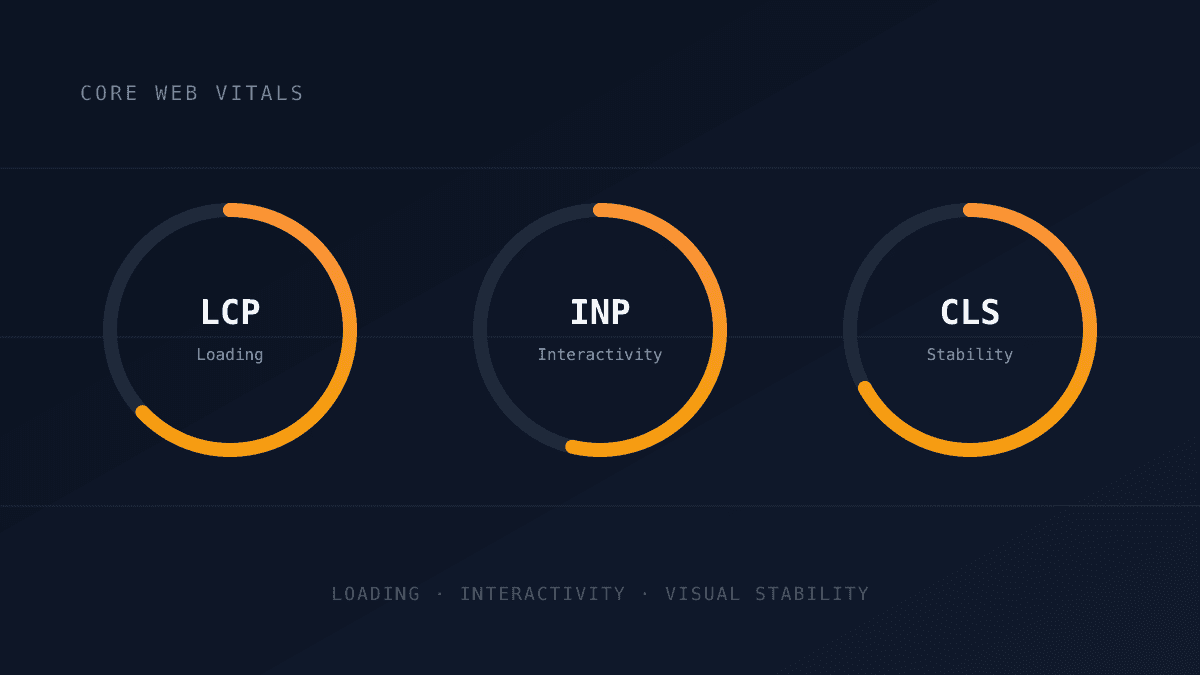
Most advice about website speed stops at "make it faster." Google's Core Web Vitals go further: three specific, measurable signals that judge whether your site actually feels fast and stable to a real visitor, and they factor directly into how your pages rank in search results.
At Portage Now, every custom build and migration is benchmarked against these three metrics before launch, not just page speed in general, because they are what decides whether a visitor stays or bounces within the first few seconds.
Largest Contentful Paint (LCP)
LCP measures how long it takes for the biggest visible element on a page, usually a hero image, heading, or banner, to fully render. Google considers 2.5 seconds or faster to be good, 2.5 to 4 seconds needs improvement, and anything slower is poor. Slow LCP is almost always caused by unoptimized images, render-blocking scripts, or a slow server response. The fix depends on which of those it actually is: preloading the specific image or font the LCP element depends on, serving images in modern formats at the right size, and making sure the server responds quickly instead of leaving the browser waiting before it can even start rendering. We address all three directly through image optimization, preload hints, and server-side rendering choices on every build.
Interaction to Next Paint (INP)
INP measures how quickly a site responds after a visitor actually does something: taps a button, opens a menu, submits a form. It replaced the older First Input Delay metric in 2024 specifically because First Input Delay only measured the first interaction on a page, while INP measures responsiveness across every interaction during the visit, a much closer match to how a real visitor actually experiences a site. A site that looks fast but freezes for half a second after every click will fail this metric even if LCP is excellent. Good is under 200 milliseconds, needs improvement is 200 to 500, and poor is anything slower. Heavy, unoptimized JavaScript is the usual cause, specifically long tasks that block the browser's main thread and delay it from responding to input, which is why breaking large scripts into smaller chunks and deferring anything not needed immediately is the most direct fix.
Cumulative Layout Shift (CLS)
CLS measures visual stability, whether elements jump around as the page loads. Anyone who has tried to tap a button just as an ad or image pushed it lower on the screen has felt bad CLS firsthand. Good is a score under 0.1, and anything above 0.25 is poor. It is fixed by reserving space for images, ads, and embeds before they load instead of letting the layout resize around them, and by watching for web fonts that render in a different size or width than their fallback font, which is a less obvious but common source of late-loading shift.
The 75th Percentile Rule Almost Nobody Explains
Google doesn't score a page on its best load, or even its average load, it scores the 75th percentile of real visits over a rolling 28-day window, measured across whatever mix of devices, connections, and locations actually make up your traffic. That means a page can load instantly for most visitors and still fail Core Web Vitals if a meaningful slice of visits, on older phones or slower connections, come in slow enough to drag the 75th percentile below the threshold. This is also why fixing Core Web Vitals doesn't show results in Search Console overnight: the reported score is always a trailing 28-day window, so a fix made today takes weeks to fully replace the older, slower data still inside that window.
Mobile and Desktop Are Scored Separately
Google evaluates Core Web Vitals separately for mobile and desktop, and mobile is what counts most for most sites, since Google indexes and ranks primarily using the mobile version of a page. A site can pass comfortably on desktop, where processing power and network speed are rarely the bottleneck, and still fail on mobile because of the exact same JavaScript, images, and fonts running on slower hardware. Checking only a desktop browser's DevTools and assuming the mobile score matches is one of the most common reasons a team is surprised by a failing report in Search Console.
How to Actually Check Your Site's Scores
Google PageSpeed Insights and Chrome DevTools' Lighthouse panel both run a lab test: a single, controlled page load that's useful for diagnosing what's slow, but doesn't reflect real user conditions. Google Search Console's Core Web Vitals report, by contrast, shows field data, the actual 75th-percentile scores from real visitors, which is what impacts rankings. Checking PageSpeed Insights alone and assuming it matches what real visitors experience is a common gap; the field data in Search Console is the number that actually matters for search, and it's worth checking regularly rather than only when something feels wrong.
Why This Matters for Your Business Website
These three metrics feed directly into Google's ranking signals, and they are measured from real user data through the Chrome User Experience Report, not just a lab test. A site that fails Core Web Vitals on mobile can rank lower than a slower-looking competitor that passes them. This is why performance benchmarking is built into our process from the first line of code, not bolted on after launch.
If you want to know how your current site scores on these three metrics, and what it would take to fix them, our Pricing page outlines what a performance audit includes, or you can reach out through our Contact page for a free technical review.
Frequently Asked Questions
Let’s Build Something Great Together
Transform your ideas into a powerful online experience with high-performance web engineering and seamless migrations.