PageSpeed Insights Report: How to Actually Read the Results
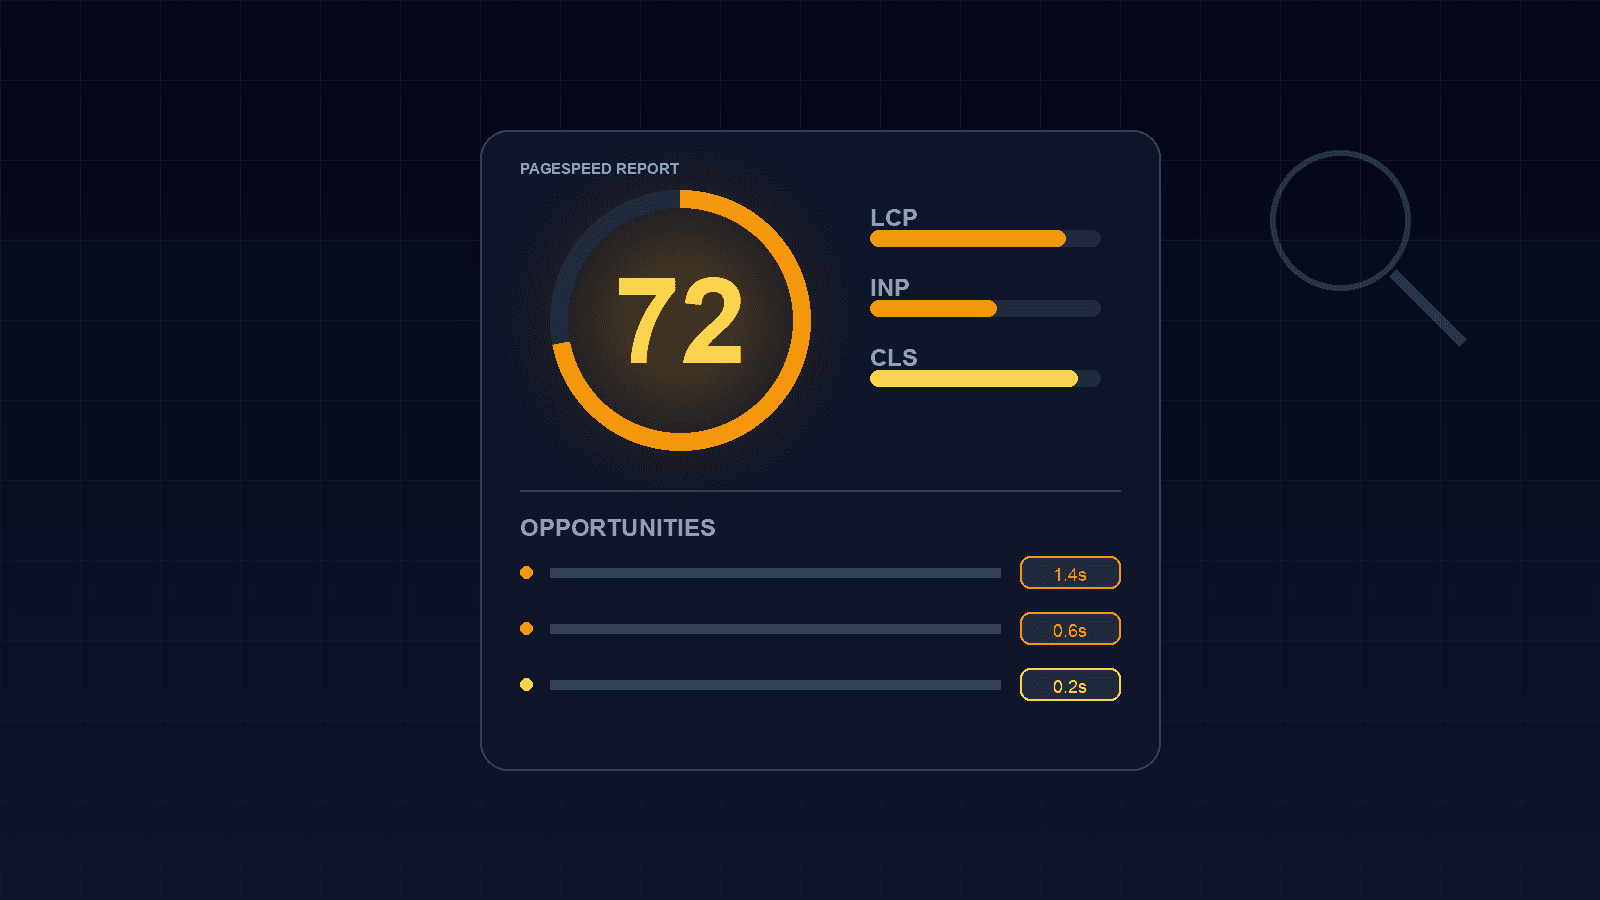
You ran your site through PageSpeed Insights, or someone handed you a Lighthouse report, and now you're staring at a score, a wall of colored bars, and terms like "Speculative Loading" and "Cumulative Layout Shift." None of it explains what to actually do next. That gap between getting a report and understanding it is common, and it's worth closing, because the report itself is genuinely useful once you know which parts to trust and which parts to ignore.
The performance score isn't the point
The 0-100 number at the top feels like the headline, but it's a weighted composite of several sub-metrics, run once, in a simulated environment. It moves a few points between identical back-to-back runs simply from network variance, and a site can score 65 while still passing Google's actual Core Web Vitals ranking thresholds, or score 95 while failing them. Treat the score as a rough directional signal, not a grade to chase for its own sake. What matters for both users and rankings sits one level below it, in the individual metrics.
Lab data vs. field data, and why they disagree
PageSpeed Insights actually shows two different data sources, and conflating them causes most of the confusion. Lab data is a single simulated test run on a fixed device and network profile. Field data, when available, comes from the Chrome User Experience Report: real visitors, real devices, aggregated over the previous 28 days. A site can lab-test slow but field-test fine if its actual visitors are mostly on fast connections and modern phones. Field data is what Google uses for search ranking purposes, so if your report shows a "no field data available" notice, that's worth fixing on its own, since it means Search Console can't show you real ranking-relevant numbers either.
The three numbers worth tracking
Underneath the score are the three Core Web Vitals: Largest Contentful Paint, Interaction to Next Paint, and Cumulative Layout Shift, covering load speed, responsiveness, and visual stability. We cover what each one actually measures and why in our Core Web Vitals explainer; the short version for reading a report is that these three are the only metrics with a pass/fail threshold tied to search ranking, so a red or yellow badge next to any of them deserves more attention than a low score on a metric with no such threshold.
Mobile vs. desktop: which report to trust
PageSpeed Insights runs mobile and desktop as two separate reports with different thresholds, and it's common to see a healthy desktop score next to a poor mobile one for the same page. Since Google indexes and ranks primarily off the mobile version of a site, the mobile report is the one that matters most for most businesses, even if the team mainly views the site on a desktop during development. Desktop is worth prioritizing only when the actual audience is genuinely desktop-heavy, such as an internal tool. For a typical marketing or e-commerce site, a strong desktop score next to a weak mobile one is not a passing grade.
Reading Opportunities and Diagnostics
Below the metrics, the "Opportunities" and "Diagnostics" sections list specific, prioritized fixes: unused JavaScript, render-blocking resources, oversized images, and similar. Each opportunity comes with an estimated time savings, and that number is what determines priority, not how alarming the audit name sounds. An opportunity estimating 50 milliseconds of savings is not worth an afternoon of engineering time; one estimating 2 seconds usually is. Work down the list by potential savings, not by the order the report lists them in.
What to deprioritize
Some audits are legacy holdovers that no longer affect ranking directly, like "Time to Interactive," which Google's own guidance has moved away from in favor of INP. Others are edge-case checks, like specific third-party cookie or console-error audits, that matter for code hygiene but won't move your Core Web Vitals numbers. A report with 15 flagged items rarely needs 15 fixes; it usually needs the two or three tied to your worst-scoring vital.
A red score doesn't always mean what you think
Lab tests throttle the simulated connection and device to represent a mid-range phone on a slower network, deliberately worse conditions than many real visitors experience. A site that scores poorly in the lab report but shows healthy Core Web Vitals in the field data isn't broken; it's being tested against a harsher baseline than its actual audience. This is exactly why field data, when available, should settle any disagreement with the lab score rather than the other way around.
How often to actually re-run the report
A report is a snapshot, not a monitor, so re-running it after every minor content update isn't necessary and mostly just adds noise from run-to-run variance. It's worth re-checking after any real change that could plausibly affect load, a new hero image, a new script, a CMS or theme update, and otherwise on a light monthly cadence to catch drift before it compounds. The field data view in Search Console updates on its own 28-day rolling window regardless of how often you manually re-run a lab test, so that's the number to watch for whether real visitors are actually seeing an improvement.
None of this replaces an actual audit of your specific site, but it should make the next report you receive far less opaque. If your last report left you with more red bars than answers, our Services page covers how we approach a performance-focused rebuild, or reach out through Contact for a direct look at what's actually worth fixing on your site.
Frequently Asked Questions
Let’s Build Something Great Together
Transform your ideas into a powerful online experience with high-performance web engineering and seamless migrations.